Severn Trent Reservoirs
I realised a couple of years ago that Severn Trent (my local water company) publishes information about how full their reservoirs are. Given the… interesting situation we find ourselves in visa-vie climate, it’s interesting to me to see how this is actually changing year on year. Are the water levels about where we’d expect? Are we down? Up? Is their precedent?
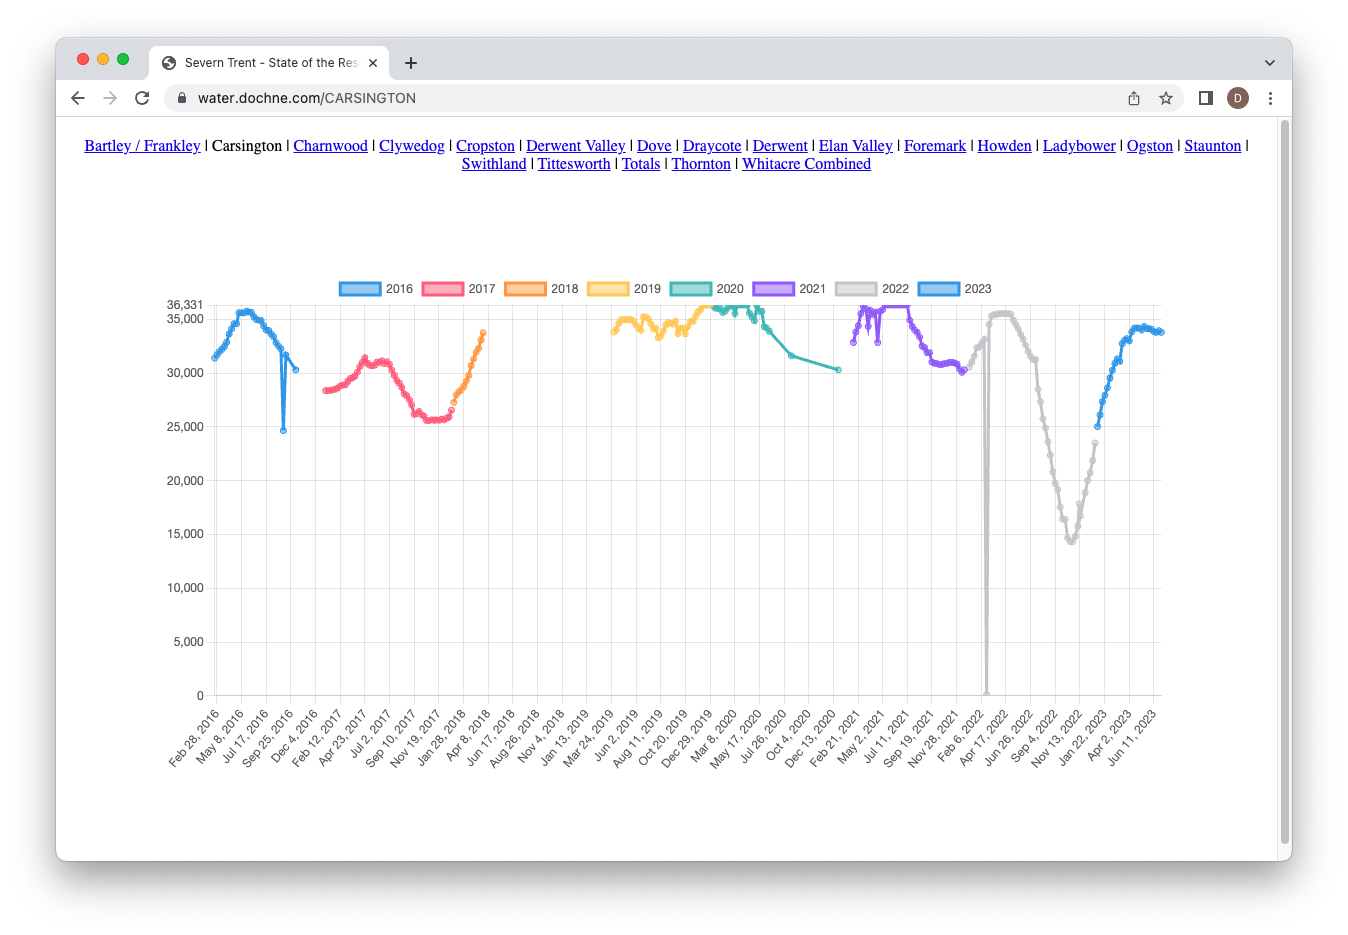
Unfortunately, the website is pretty awful for actually displaying this - it gives us the how full the reservoirs are in an HTML table week by week, but no easy way to meaningfully interpret it. In other words, data not information.
As such, I build a tiny scraper for it and built out a dashboard. It has some labelling problems (due to the source data) and could definitely be prettier - but it gives us something resembling meaninful data.
You can view it here and view a blog post descriing how it’s built here